We can't find the internet
Attempting to reconnect
Something went wrong!
Hang in there while we get back on track
Tile Hunting with Open-Source Tools
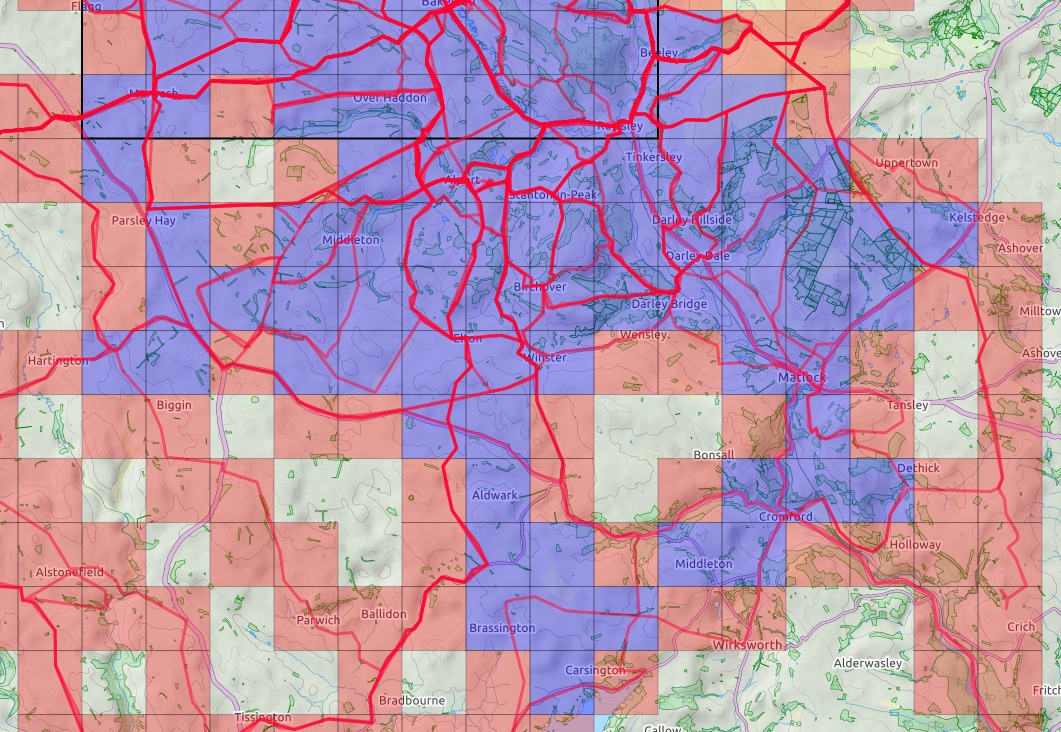
Tile hunting adds a simple exploration game to cycling, walking, running, and other outdoor activities. A map is divided into a fixed grid, and every tile crossed by one of my recorded GPS tracks is marked as explored.
This creates a different motivation from conventional activity statistics. Distance, speed, and elevation still matter, but tile hunting also rewards curiosity. A single missing tile can be enough reason to leave a familiar route, investigate a side road, or visit a nearby place that I have never seen before.
Two sizes of tiles
The grid is based on the same Web Mercator tile system commonly used by online maps. At every zoom level, the world is divided into more tiles: increasing the zoom level by one splits every tile into four smaller tiles—two in each direction.
I collect tiles at two zoom levels:
- Zoom level 14 (
z14) for larger-scale exploration - Zoom level 17 (
z17) for detailed local exploration
At the latitude of Germany, a z14 tile is roughly 1.5 kilometres wide. This makes it a useful size for cycling: the tiles are small enough to encourage exploration but large enough that a substantial area can be covered during a bicycle ride.
The z17 grid is considerably finer. There are three zoom levels between z14 and z17, and every additional level halves the width of a tile. A z17 tile is therefore one eighth as wide as a z14 tile, or roughly 190 metres across in Germany.
In terms of area, one z14 tile contains an ( 8 \times 8 ) grid of z17 tiles:
[ 8 \times 8 = 64 ]
The finer z17 tiles are sometimes called squadratinhos. They work particularly well for walking and for detailed exploration close to home. While a bicycle ride can quickly cross a large number of z14 tiles, filling the z17 grid may require visiting individual streets, paths, parks, and corners of a neighbourhood.
When is a tile explored?
The basic rule is deliberately simple: a tile counts as explored when at least one recorded activity enters it.
Once a track enters a tile, that tile becomes part of my explored map. It does not matter how far I travel through it—a short visit across one corner is sufficient.
This simplicity occasionally makes route planning more interesting than expected. A road may appear to pass through a tile but remain just outside its boundary. Conversely, a small detour of only a few metres may be enough to collect it.
Building a cluster
Collecting isolated tiles is enjoyable, but the more interesting goal for me is to create a large connected area.
The software I use distinguishes between an explored tile and a cluster tile. An explored tile becomes part of the cluster calculation when all four of its direct neighbours have also been explored:
- the tile to the north,
- the tile to the south,
- the tile to the east,
- and the tile to the west.
Diagonal neighbours do not count.
This means that simply drawing a narrow line of explored tiles through the landscape does not create a large cluster. To activate the tiles along that line, I also need to explore the surrounding tiles. The result rewards broad, continuous coverage rather than isolated routes.
Adjacent cluster tiles are grouped into connected clusters. A single missing tile can prevent parts of an explored area from joining together, while filling one strategically placed gap may connect several smaller clusters into a much larger one.
That is why gaps become particularly tempting. On the map, they are immediately visible as holes in an otherwise explored region. Filling them often becomes the objective of my next ride.
Growing the maximum square
The maximum square is a related but even stricter challenge. It is the largest completely explored square that can be placed on the tile grid.
A maximum square of size ( n ) must contain ( n \times n ) explored tiles without any gaps. For example:
- a square of size 5 contains 25 tiles,
- a square of size 10 contains 100 tiles,
- and a square of size 20 contains 400 tiles.
Increasing a square from size ( n ) to size ( n + 1 ) becomes progressively harder. It requires adding an entire row and an entire column around the existing square:
[ (n + 1)^2 - n^2 = 2n + 1 ]
Growing a 10 × 10 square into an 11 × 11 square therefore requires at least 21 additional tiles—and possibly more if the square has to move in a different direction to avoid inaccessible areas.
The square must also remain completely filled. One missing tile caused by a river, railway, motorway, military area, industrial site, or private property can block expansion in that direction. This turns the maximum square into both an exploration challenge and a routing puzzle.
In practice, the cluster and maximum square encourage slightly different strategies:
- Total explored tiles reward going anywhere new.
- The cluster rewards connecting and filling a wider region.
- The maximum square rewards systematic and gap-free exploration.
I mainly use the z14 grid for bicycle rides and for extending my regional cluster and maximum square. The much finer z17 grid provides a separate challenge for local exploration, where individual streets and paths make a visible difference.
Commercial platforms such as Squadrats and VeloViewer provide similar functionality. My setup, however, is based on open-source tools and keeps the activity data under my control.
Recording and importing activities
Most of my activity data comes from Garmin Connect. I record walks and other activities with a Garmin Instinct 2, while bicycle rides are recorded with a Garmin Edge Explore 2.
To retrieve the original activity files from Garmin Connect, I use GarminDB. Besides downloading activity files, GarminDB can import Garmin health and activity data into local SQLite databases. Importantly, it retains the downloaded FIT and JSON files, so they can be processed again without repeatedly downloading them from Garmin Connect.
These activity files are then imported into Geo Activity Playground, a self-hosted application for exploring GPS tracks. It accepts several common formats, including FIT, GPX, TCX, KML, and CSV.
Geo Activity Playground provides much more than tile hunting—such as heatmaps, activity statistics, equipment tracking, and yearly summaries—but its Explorer Tiles are the feature that interests me most.
Planning routes to unexplored tiles
Knowing which tiles are missing is only half the job. I also need a convenient way to plan routes through them.
Geo Activity Playground exposes the explored tiles through a map tile server. I add that server as a custom overlay in Bikerouter, my preferred tool for planning bicycle routes.
Bikerouter supports custom tile layers, so my explored area can be displayed directly on top of the routing map. I can immediately see:
- which tiles I have already visited,
- where there are gaps in my cluster,
- and which roads could connect new tiles to the existing area.
From there, I plan a route that passes through the missing tiles, export it, and transfer it to my bicycle computer. After completing the ride, the new Garmin activity passes through the same processing pipeline and the additional tiles appear on the map.
The result is a satisfying loop:
- Record an activity with a Garmin device.
- Extract the original activity file using GarminDB.
- Import it into Geo Activity Playground.
- Inspect the newly explored tiles.
- Plan the next ride in Bikerouter.
- Extend the connected cluster.
Displaying the results on my website
The tile server is not limited to route planning. I also use it to display my explored area on the /tiles page of this website.
The map itself loads the tiles exposed by Geo Activity Playground. Additional statistics are queried through Datasette, which provides a web interface and JSON API for the underlying SQLite data.
This is currently a small workaround: Geo Activity Playground does not yet expose the statistics I need through a dedicated API. Datasette lets me access them without introducing a separate application or duplicating the data.
Why I prefer this setup
The setup has more moving parts than registering with a commercial tile-hunting service, but it also gives me considerably more control:
- My original activity files remain available locally.
- The processing is performed with open-source software.
- I am not tied to a particular activity platform.
- The tile layer can be used in different maps and routing tools.
- I can publish the map and statistics on my own website.
- I can adapt the workflow when my requirements change.
Most importantly, tile hunting gives me a reason to explore. A small gap in the cluster can turn an ordinary bicycle ride into a route-planning puzzle—and often leads me to interesting places surprisingly close to home.
For years I’ve used InfluxDB as my main database for logging all kinds of time-based data. It’s reliable, lightweight, and well-suited for storing metrics or events. One of the more personal data streams I collect is my own location history, captured through OwnTracks on Android. The app continuously sends geo-coordinates to my server, where they’re stored in InfluxDB.
Until now, my usage was simple: I would pull up a map view of a single day or a couple of weeks and see where I had been. It was more about having a “quantified self” archive than about running complex analysis. Recently, though, I started asking: what’s possible if I treat this data more seriously?
Setting up Geo-Temporal Data in InfluxDB
OwnTracks logs latitude/longitude points every few minutes. In my case:
- Around 91,000 points per year (every 6 minutes).
- A single day of data is easy to visualize, but over longer time spans, performance matters.
- I wanted to test whether InfluxDB’s S2 index could make queries faster when filtering spatially. Thanks Matthias for the hint :)
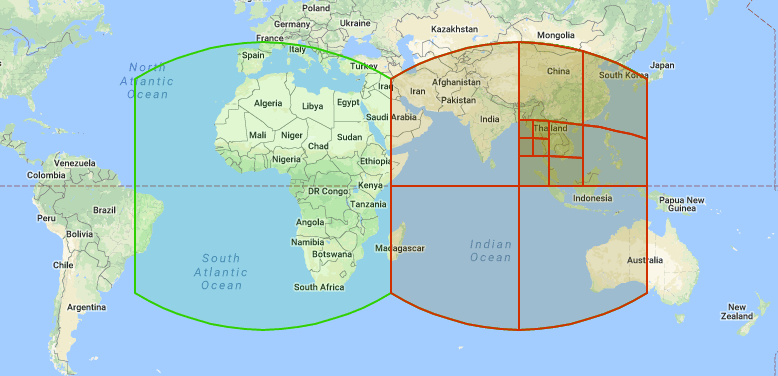
The S2 index is a way of mapping latitude/longitude coordinates onto a hierarchical cell system that’s easier to query than raw floats. Instead of searching through raw coordinates, InfluxDB can quickly filter based on cell IDs.
Performance Benchmark
I compared two setups:
- With
s2_cell_idpresent: data stored with precomputed S2 cell IDs. - On the fly: InfluxDB computes S2 cells during query time.
Dataset: one year of data (~91k points).
Typical filter returned ~2,300 points (≈2.5%).
Results
| Query type | With S2 index | On the fly |
|---|---|---|
| Raw data (wide form) | 7.18s | 13.1s |
| Filter @ level 10 | 7.49s | 20.48s |
| Filter @ level 11 | 8.28s | 21.37s |
| Filter @ level 12 | 11.16s | 24.05s |
Observations
- Even with S2 indexing, base query cost dominates: fetching raw data is the main bottleneck.
- The index does help: filtering is roughly 2–3× faster compared to on-the-fly calculations.
- Increasing resolution (higher S2 levels) increases query time, so there’s a trade-off between spatial precision and performance.
A Short Note on S2 Geometry
S2 is a geometry library originally developed at Google. Its core idea is to represent the Earth’s surface by projecting it onto the faces of a cube, which is then subdivided recursively into cells by using Hilbert curves. S2 Geometry
- Each S2 cell is identified by a unique integer ID.
- Cells can be subdivided hierarchically, so you can choose different levels of resolution (coarse regions vs. fine-grained areas).
- This makes spatial queries (like “points within this area”) much faster than comparing raw lat/long values.
In short: S2 turns messy geo data into something databases can index efficiently.
And now
So far, my experiments confirm that S2 indexing is useful for speeding up geo-temporal queries in InfluxDB, but the raw data size and query design still matter a lot.
For my personal use case — reviewing trips, walks, and places I’ve been — the current performance is good enough. But this exploration opens doors:
- Building aggregate views (e.g. heatmaps of most-visited areas).
- Running long-term analyses (seasonal mobility, time spent in places).
- Integrating with visualization tools beyond simple day-by-day maps.
InfluxDB, OwnTracks, and S2 indexing give me an okayish base. The next step is to think less like a log collector and more like a geospatial analyst. Well the last sentence I would not have written myself. Otherwise I am good creating the blog post with the help of ChatGPT.
One of the most frequent and practical uses for note-taking tools in our daily life is managing a shared grocery list. I like to keep and update the list with Selma — often simultaneously, while one of us is already in the store.
Over time, we tried several approaches to make this work smoothly, especially with self-hosted tools. We first used classical note-taking apps like:
Unfortunately, we ran into sync issues with both. Items would go missing, checkboxes wouldn’t update correctly, or changes wouldn’t appear on the other person’s device in real-time. It became clear we needed something more tailored for real-time, shared editing.
Eventually, we settled on a tool called specifically clementines (previously named grocies). It's a minimalist web app designed exactly for this use case — keeping a shared, synced grocery list.
Technically, specifically clementines is built on CouchDB, a document-oriented NoSQL database that supports multi-master replication. This means changes from multiple clients can be merged automatically — ideal for shared lists edited from different locations and devices at the same time. It also makes offline-first usage possible.
Setting it up was a bit involved: in my case, it needed three dedicated subdomains (for the app backend, frontend and CouchDB), but once deployed, it has worked as expected.
If you're also looking for a reliable, real-time shared list app and don't mind a little self-hosting work, I can highly recommend giving it a try.
I made a little spinoff of the blog to write about traveling with Selmi. It is in German.
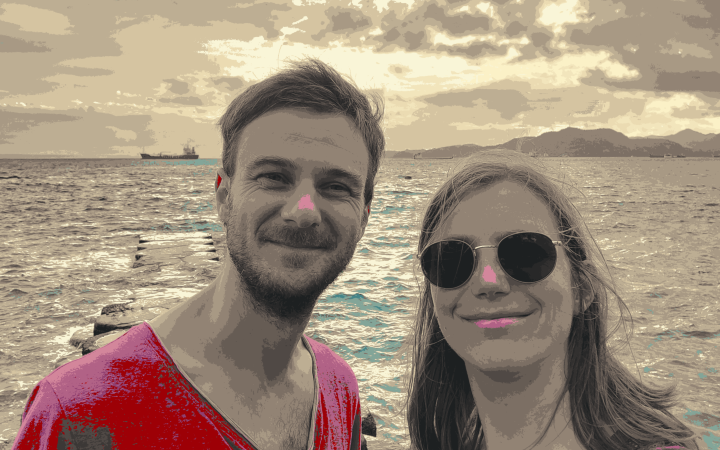
Today I want to share a small little tool, which converts your favorite images and wallpapers with a given color palette. This makes it inedible easy to create a consist styling. And your style is everything.
The tool is called dipc and is of course written in Rust. Give it a try!
I used the following settings for the header image.
dipc -s "Dark mode" gruvbox original_image.jpg
Btw. do you know which delicious fungi is featured in the header?

I am not the most passionate youtube consumer. I mainly watch educational videos (How to repair XY, how to do something), but there are a few exceptions of course. Both recommendations here are german and I know the creators, so I might be a bit biased.
Pfadgefährten
Hannes and Tobi are hiking with different animals in the Kyrgyz mountains. Right now only the trailer is available, but seems like a great adventure. Also Hannes is my landlord and he is a great guy, who knows how to tell stories. Trailer
Sailing Lea
Johannes and Olena are sailing around the world with their yacht. Great pictures and the relaxed sailor lifestyle are making me quite jealous. I can connect, as I also enjoy sailing and I have briefly met Johannes two or three times. Channel

In the last months I added and also removed some content from the thepid.de. Three new pages are waiting for you to be explored.
view /gardencam
content
Have a look in my garden and enjoy the green scenery. You can also see how the weather conditions are in the garden.
tech
Pictures are taken with a Logitech external webcam attached to a rpi4. motioneye is taking care of the webcam feed and shooting of the pictures. Pictures are uploaded to a self-hosted minio instance. Temperature, humidity and pressure readings are from a ruuvi tag, which is integrated in the home assistant instance running on the same rpi4. Home assistant sends the data to a self-hosted influxdb database, which is then queried from thepid.de
now /now
content
I think this one is pretty self-explaining. Just have a look.
tech
Hard-coded for now.
starred /starred
content
A list of blog posts, which I have starred in my feed reader. Probably pretty random, german, english, mixed topics. Not very curated at the moment. But I guess it will improve.
tech
Simple API call to my self-hosted miniflux instance. Love it.
This year has been an exceptionally good for chili. As you may not know I like hot food and have become a passionate chili gardener and consumer.
The harvest
Unlike previous years I could harvest a lot of chilies already in July and August. I think this is because I overwintered some plants and also build a raised bed, which dramatically accelerates the growth of the plants. I grow several chili strains this year, including two different kinds of habaneros, scotch bonnets, lemon drop, and some others I forgot the name ;)


Preparation
The sauce I prepared this time was more or less free style with ingredients readily available in the garden and kitchen. I like to combine chili with something fruity. This time I used figs from the garden and pears picked from some trees.
Preparation is easy. Cut the chilies and fruits, roast or cook them for some minutes, add some vinegar and lemon juice and finally blend it!


The result
Very tasty and also pretty hot.

I like being able to subscribe to random websites using rss/atom feeds. I self host a miniflux instance, where I manage my subscriptions and read articles. So naturally I wanted to implement such a feed also for thepid.de. I mean how hard can that be?
Basically it involves two steps
- Implementing a function, which builds the feed
- Serving the feed as raw xml
The first step was straightforward as soon as I stumbled upon the Atomex library. I just had to copy the example from the docs and make some adoptions regarding my schema.
  alias Atomex.Entry
  alias Atomex.Feed

  def build_feed(posts) do
    "https://thepid.de"
    |> Feed.new(DateTime.utc_now(), "ThePid Feed")
    |> Feed.author("THE", email: "thepid@mailbox.org")
    |> Feed.link("https://thepid.de/feed", rel: "self")
    |> Feed.entries(Enum.map(posts, &get_entry/1))
    |> Feed.build()
    |> Atomex.generate_document()
  end

  defp get_entry(post) do
    inserted_at = DateTime.from_naive!(post.inserted_at, "Europe/Berlin", Tz.TimeZoneDatabase)
    updated_at = DateTime.from_naive!(post.updated_at, "Europe/Berlin", Tz.TimeZoneDatabase)
    content = Earmark.as_html!(post.content, %Earmark.Options{code_class_prefix: "language-", smartypants: false})

    "https://thepid.de/blog/#{post.id}"
    |> Entry.new(updated_at, "#{post.title}")
    |> Entry.content(content, type: "html")
    |> Entry.published(inserted_at)
    |> Entry.build()
  end
The build_feed function builds the feed with entries, created through the get_entry function.
I decided to include the whole article as html in the feed, so you can read everything through your reader application.
Unfortunately this is not possible with some feeds out there.
Now we have to serve the generated document at the /feed route. Therefor just add this line to your router.ex
  scope "/", ThePidWeb do
    pipe_through :browser

    get "/feed", FeedController, :index
  end
The router will try to hit the feed controller with an index function.
defmodule ThePidWeb.FeedController do
  use ThePidWeb, :controller

  plug :put_layout, false
  plug :put_root_layout, false

  def index(conn, _assigns) do
    conn
    |> put_resp_content_type("text/xml")
    |> render(:feed)
  end
end
Here I specified the response type as text/xml and removed all layouts.
Finally the render functions expects a view with a feed function.
This is were the build_feed function is finally called.
defmodule ThePidWeb.FeedHTML do
  use ThePidWeb, :html

  alias ThePid.Blog

  def feed(_assigns) do
    Blog.get_all_posts()
    |> Blog.build_feed()
    |> Phoenix.HTML.raw()
  end
end
That's it. Easy peasy. Subscribe now.
While developing a certain part of thepid.de I needed to input datetime into a form.
Luckily html got you covered with datetime-local as type attribute for an input field, which works well.
However I was pretty annoyed that the format of the datetime input in my browser was the American AM/PM format.

My computer language is set to English, but locale for Date, Currency, etc.. is set to German.
This is done by setting the correspondingLC_ variables. Turns out firefox does not care about that.
After some kagiing I found a solution: Go to about:config and switch intl.regional_prefs.use_os_locales to true.
Thanks Zibi Braniecki.
Now it looks so good.

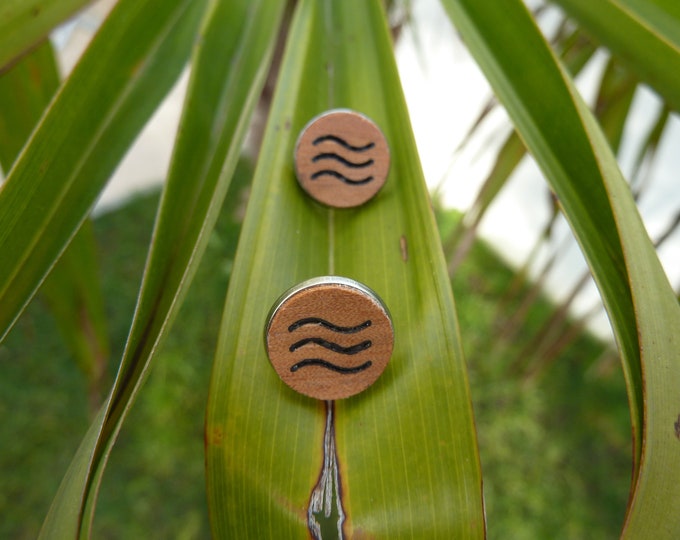
I want to recommend the shop of my friend Jones, who has recently become a craftsman. He has acquired a decent CNC for woodworking and creates now some beautiful earrings.
I firsthand know his customers are very pleased and can affirm the superb quality of the artwork with my own hands.
Zweig und Zunder
Hi there. My name is Tobi and this is my freshly created homepage. Here I want to write some interesting things which I come across in my life. Also I want to improve my coding skills and play with Phoenix and Elixir.